


XAU/USD
Prediction: Decrease
Fundamental Analysis:
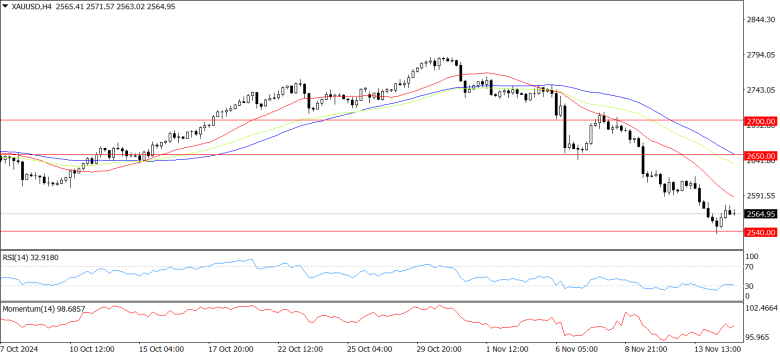
Spot gold prices dropped again, hitting a two-month low during the session as the rising U.S. Dollar Index reached a yearly high, making gold less attractive for non-U.S. buyers. Recent comments from Federal Reserve Chair Jerome Powell suggested there might not be a rate cut in December, which added pressure on gold prices.
Powell mentioned there is no rush to cut rates, which led to a drop in gold. Gold remains under pressure due to the strong dollar and recent U.S. inflation data. U.S. Producer Price Index (PPI) data exceeded expectations, suggesting the Fed might reconsider its easing cycle. According to data from the U.S. Bureau of Labor Statistics, October’s PPI rose by 2.4% year-on-year, higher than the expected 2.3% and September's 1.9%. The core PPI, often influencing the core Personal Consumption Expenditures (PCE) Price Index, increased by 3.1% from the previous year, above the prior 2.9% and the forecasted 3%.
Technical Analysis:
Gold prices recently fell below the October 10 low of $2,603 per ounce, accelerating their decline after breaking the $2,600 mark. This opened the way for a two-month low of $2,536 per ounce. Gold briefly dropped below its 100-day Simple Moving Average (SMA) of $2,547. If prices go below $2,536, they could fall further toward the $2,500 level. The Relative Strength Index (RSI) has moved away from the neutral line, indicating a bearish trend, which may lead to more declines. On the upside, the first resistance level is around $2,600. If buyers regain this level, prices could test the 50-day moving average of $2,650, followed by resistance near $2,700. A break above these levels could open the path to the November 7 high of $2,710 per ounce.
USD/JPY
Prediction: Increase
Fundamental Analysis:
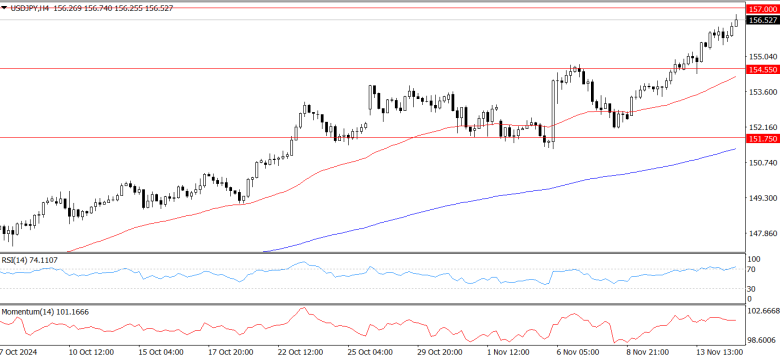
The USD/JPY pair continues to rise, reaching around 156.60, the highest level since July, during early Friday’s Asian session. This increase is supported by the stronger US Dollar.
Traders are awaiting US October Retail Sales data due later in the day. Japan's preliminary GDP for Q3 showed 0.2% growth quarterly, matching expectations but lower than the previous 0.5%. The annualized GDP growth was 0.9%, slightly above the 0.7% forecast but down from Q2’s 2.2% growth, keeping the Yen weak after the release. Bank of Japan (BoJ) Governor Kazuo Ueda noted that income data will be closely watched for future policy, adding uncertainty around rate hikes. However, statements from Japanese officials may help limit the Yen’s losses.
Technical Analysis:'
From a technical view, USD/JPY's recent rise above the 61.8% Fibonacci level from the July-September drop and a close over the 155.00 level on Wednesday support a bullish outlook. Daily chart indicators show positive momentum without nearing overbought levels, hinting that USD/JPY may continue higher. A move above 156.00 could lead to testing resistance around 156.55-156.60, with potential to reach 157.00 and even the 157.30-157.35 area. On the downside, support around 155.35-155.30, followed by the 155.00 level, could limit immediate declines. A break below 155.00 might lead to further selling, targeting support at 154.55-154.50, then 154.00, with additional support at 153.80 and 153.45.
EUR/USD
Prediction: Decrease
Fundamental Analysis:
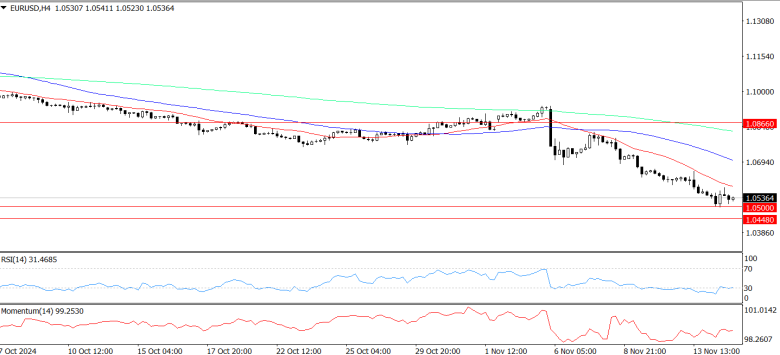
On Thursday, EUR/USD briefly dropped to new lows for the year, breaking below 1.0500 for the first time in over a year. Limited European data is not providing much support for the Euro, so demand for the safe-haven US Dollar is pushing EUR/USD down. Recent European GDP data didn’t boost the Euro, as it met expectations: quarterly growth was 0.4%, and annual growth was 0.9%.
Producer Price Index (PPI) data, showing producer-level inflation, was mostly in line with forecasts. October’s headline PPI rose 0.2% compared to the previous month’s 0.1%, while core PPI grew slightly faster than expected, reaching 3.1% year-on-year.
Technical Analysis:
The EUR/USD daily chart shows strong downward momentum. The pair has dropped below both the 50-day and 200-day Exponential Moving Averages (EMAs) at around 1.0867 and 1.0884, respectively. Recently, the 50-day EMA crossed below the 200-day EMA, a "death cross" signal, which usually suggests continued downward movement. EUR/USD is near multi-month lows at 1.0520, which could offer temporary support. However, any rebound may face strong resistance around 1.0700. The MACD indicator also points to a bearish outlook, with its line below the signal line in negative territory, showing continued selling pressure. Unless the pair breaks above the EMAs, the trend remains downward. If it falls below 1.0500, it may target 1.0400 next. A clear recovery above 1.0880 would be needed to shift this bearish view.
BTC/USD
Prediction: Decrease
Fundamental Analysis:
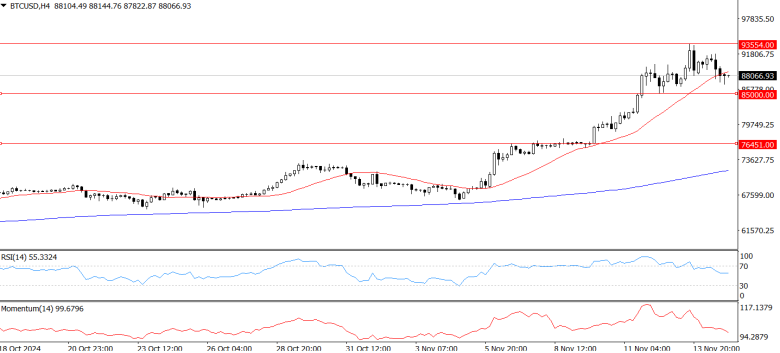
After reaching a year-high of 107.08 overnight, the US Dollar Index eased slightly to 106.86. The strong dollar has impacted crypto purchases, causing Bitcoin to drop below $87,000 and fluctuate around $86,840. Federal Reserve Chair Jerome Powell said the U.S. economy has been performing "very well," allowing the Fed to be cautious about cutting interest rates. On Thursday in Dallas, he said, "The economy isn’t signaling any urgent need to lower rates. This current strength gives us room to decide carefully." The dollar's rise to its highest level this year has raised concerns about the sustainability of the current Bitcoin rally. Crypto analyst Jamie Coutts from Real Vision warned traders to be cautious with speculative bets, saying, "The macro environment is worsening, and a strong dollar is negative for Bitcoin."
Technical Analysis:
The price of Bitcoin is "very sensitive to short- and mid-term momentum changes," and traders are advised to "use leverage cautiously." The long-term outlook is "bullish," but charts suggest that "caution" is needed in the short term. Recent reports say Trump's victory is a key reason for the dollar's strength, as his support for tariff policies has "led people to speculate that U.S. Treasury yields will rise along with inflation." During the same period, Bitcoin's price rose nearly 28%. However, the rise in safer assets like the dollar has raised concerns among Bitcoin traders, as historically, there’s been an inverse relationship between them. The dollar index is at a resistance level, and breaking through it could be unfavorable for risk assets.
Disclaimer
The market analysis provided by KVB Prime Limited is for informational purposes only and should not be construed as investment advice or a recommendation to buy or sell any financial instrument. Trading forex and other financial markets involves significant risk, and past performance is not indicative of future results.
KVB Prime Limited does not guarantee the accuracy, completeness, or timeliness of the information provided in the market analysis. The content is subject to change without notice and may not always reflect the most current market developments or conditions.
Clients and readers are solely responsible for their own investment decisions and should seek independent financial advice from qualified professionals before making any trading or investment decisions. KVB Prime Limited shall not be liable for any losses, damages, or other liabilities arising from the use of or reliance on the market analysis provided.
By accessing or using the market analysis provided by KVB Prime Limited, clients and readers acknowledge and agree to the terms of this disclaimer.
RISK WARNING IN TRADING
Transactions via margin involve products that use leverage mechanisms, carry high risks, and are certainly not suitable for all investors. THERE IS NO GUARANTEE OF PROFIT on your investment, so be wary of those who guarantee profits in trading. You are advised not to use funds if you are not prepared to incur losses. Before deciding to trade, ensure that you understand the risks involved and also consider your experience.cal U.S. jobs report scheduled for the end of this week.